
Hi! I’m Kirill Presniakov, and together with Vladimir Pchelyakov we’re iOS engineers at inDrive. Mo 2026-7-9 04:36:45 Author: hackernoon.com(查看原文) 阅读量:12 收藏
Hi! I’m Kirill Presniakov, and together with Vladimir Pchelyakov we’re iOS engineers at inDrive. Mobile performance rarely breaks all at once. It degrades quietly — one release, one screen, one percentile at a time. By the time users start complaining, the regression has often already become part of the product experience.
The right place to catch regressions is before they reach production. We do run automated performance tests with XCUITest — you can read about that approach here — but no pre-release suite covers everything. Real devices, real traffic, and real network conditions always surface things that synthetic tests miss. That means you still need to know what happened after every release ships.
We use two main data sources for iOS performance. The first is our own telemetry — performance events collected from mobile clients and stored in Elasticsearch. This covers a range of signals including screen load times, Time to Interactive, and other key interaction metrics across different user roles, markets, and order types. You can read more about our approach to mobile performance instrumentation here.
The second is native iOS metrics from Apple, available in Xcode Organizer. These include:
- launch time
- hang rate
- peak memory usage
- disk writes
- CPU activity
- battery usage
- app size
All of this data can be explored in Xcode Organizer — but only manually: open it, look through the numbers, close it. No history across releases, no alerts, no automation. In this article, we focus on the second source — how we automated it end to end, set up automatic alerts, and eliminated the need to manually check Xcode Organizer altogether.
With Xcode 27 (announced at WWDC26), Apple added a new Storage category to Xcode Organizer — tracking App Size and Documents & Data footprint over time. The metric also started appearing in the perfPowerMetrics API response. Our pipeline had been running for several months by that point, and when Apple rolled out the new metric, it just showed up and worked - no code changes, no pipeline updates needed.
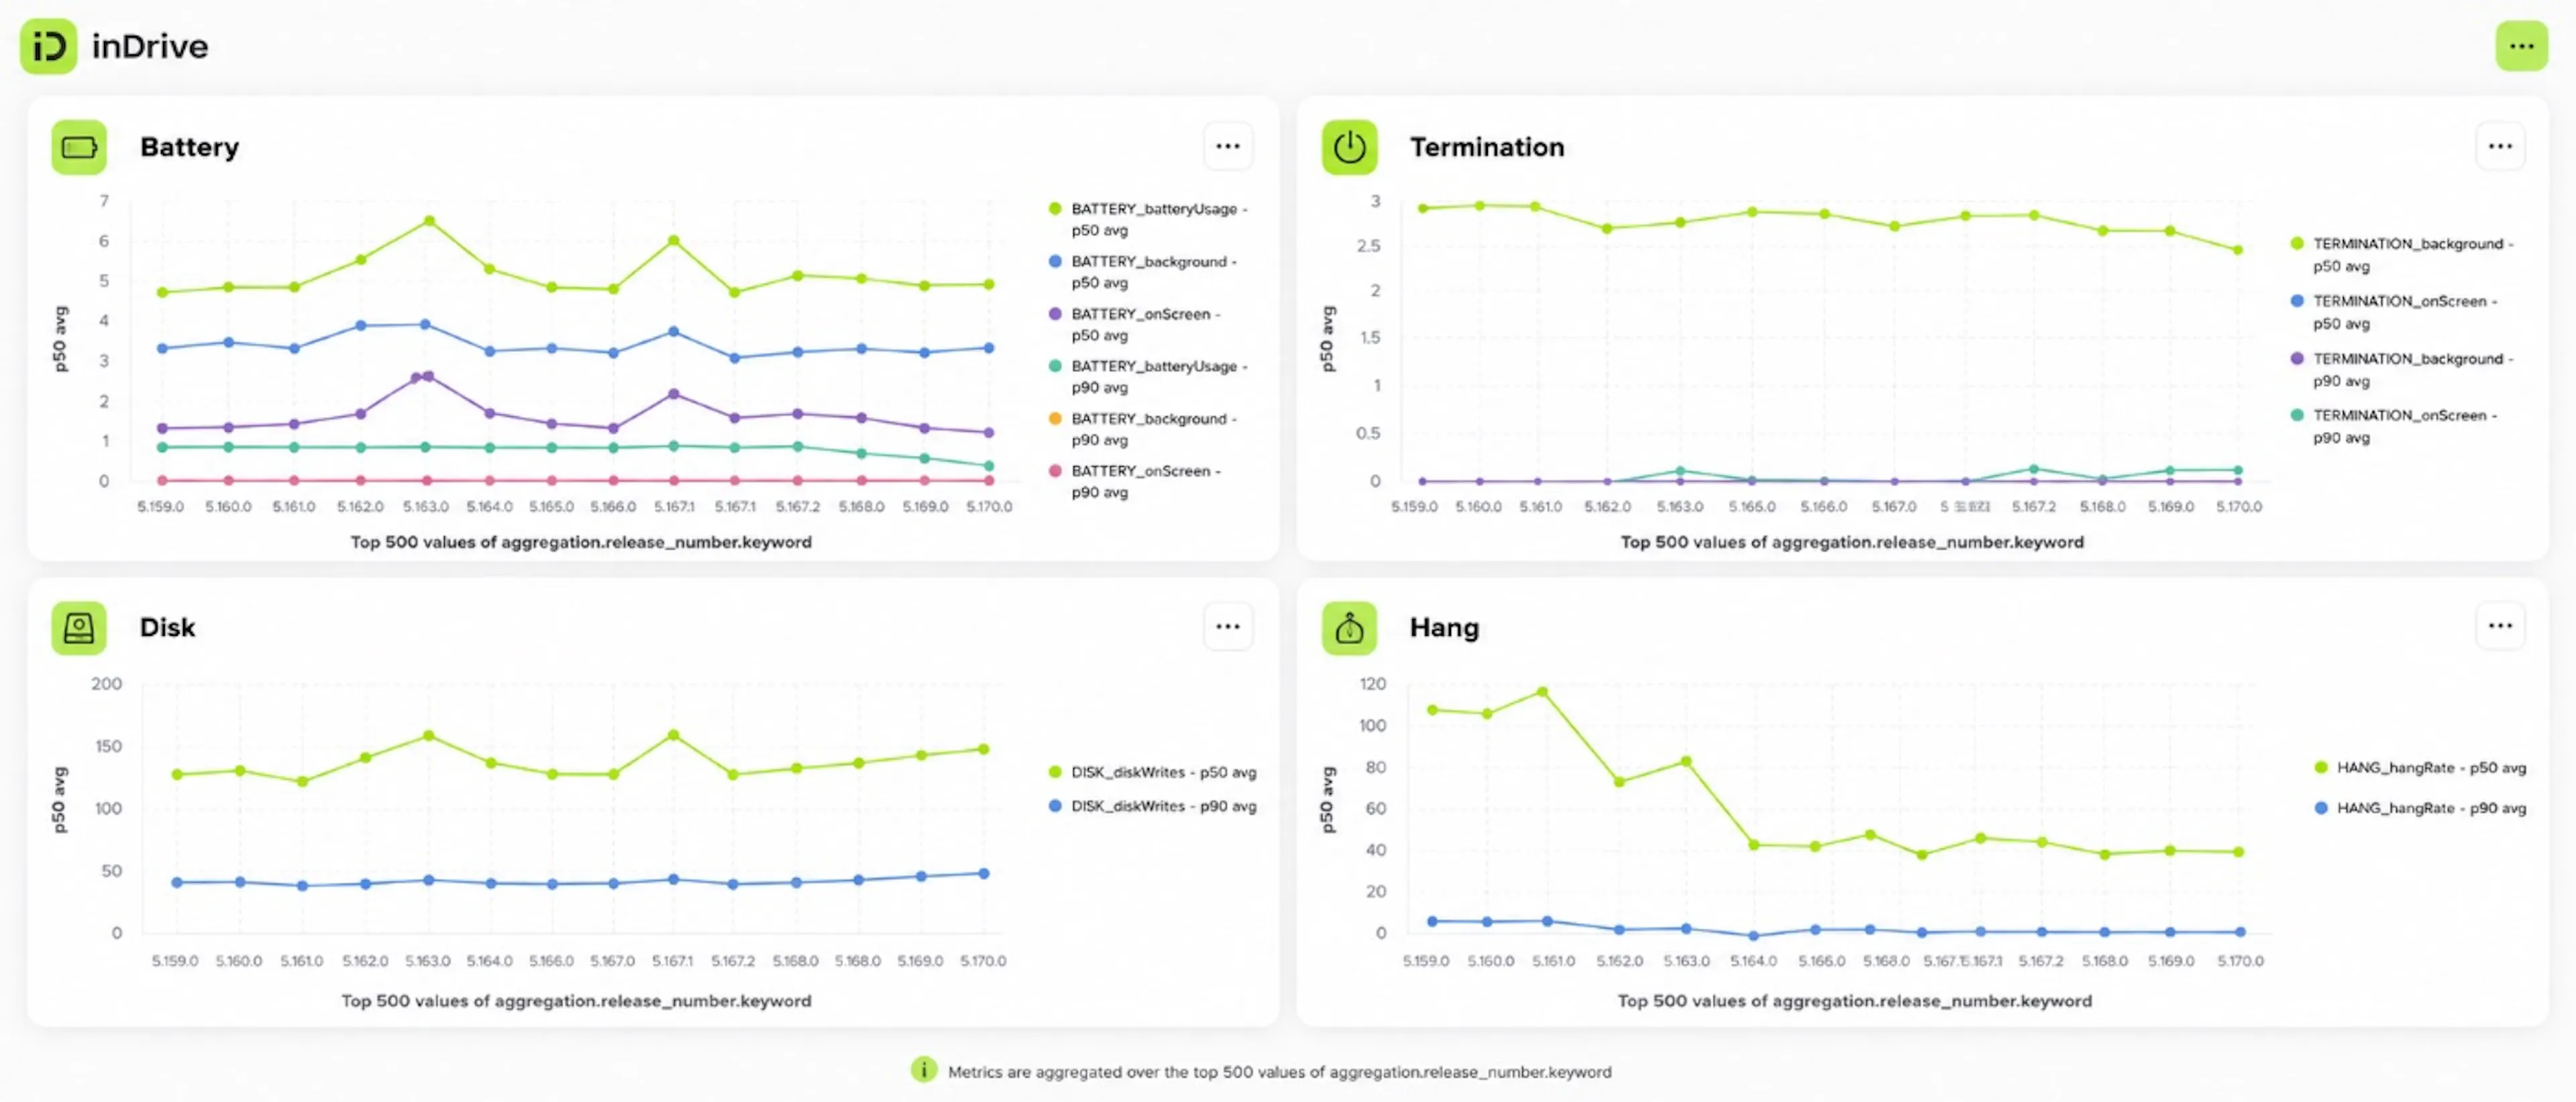
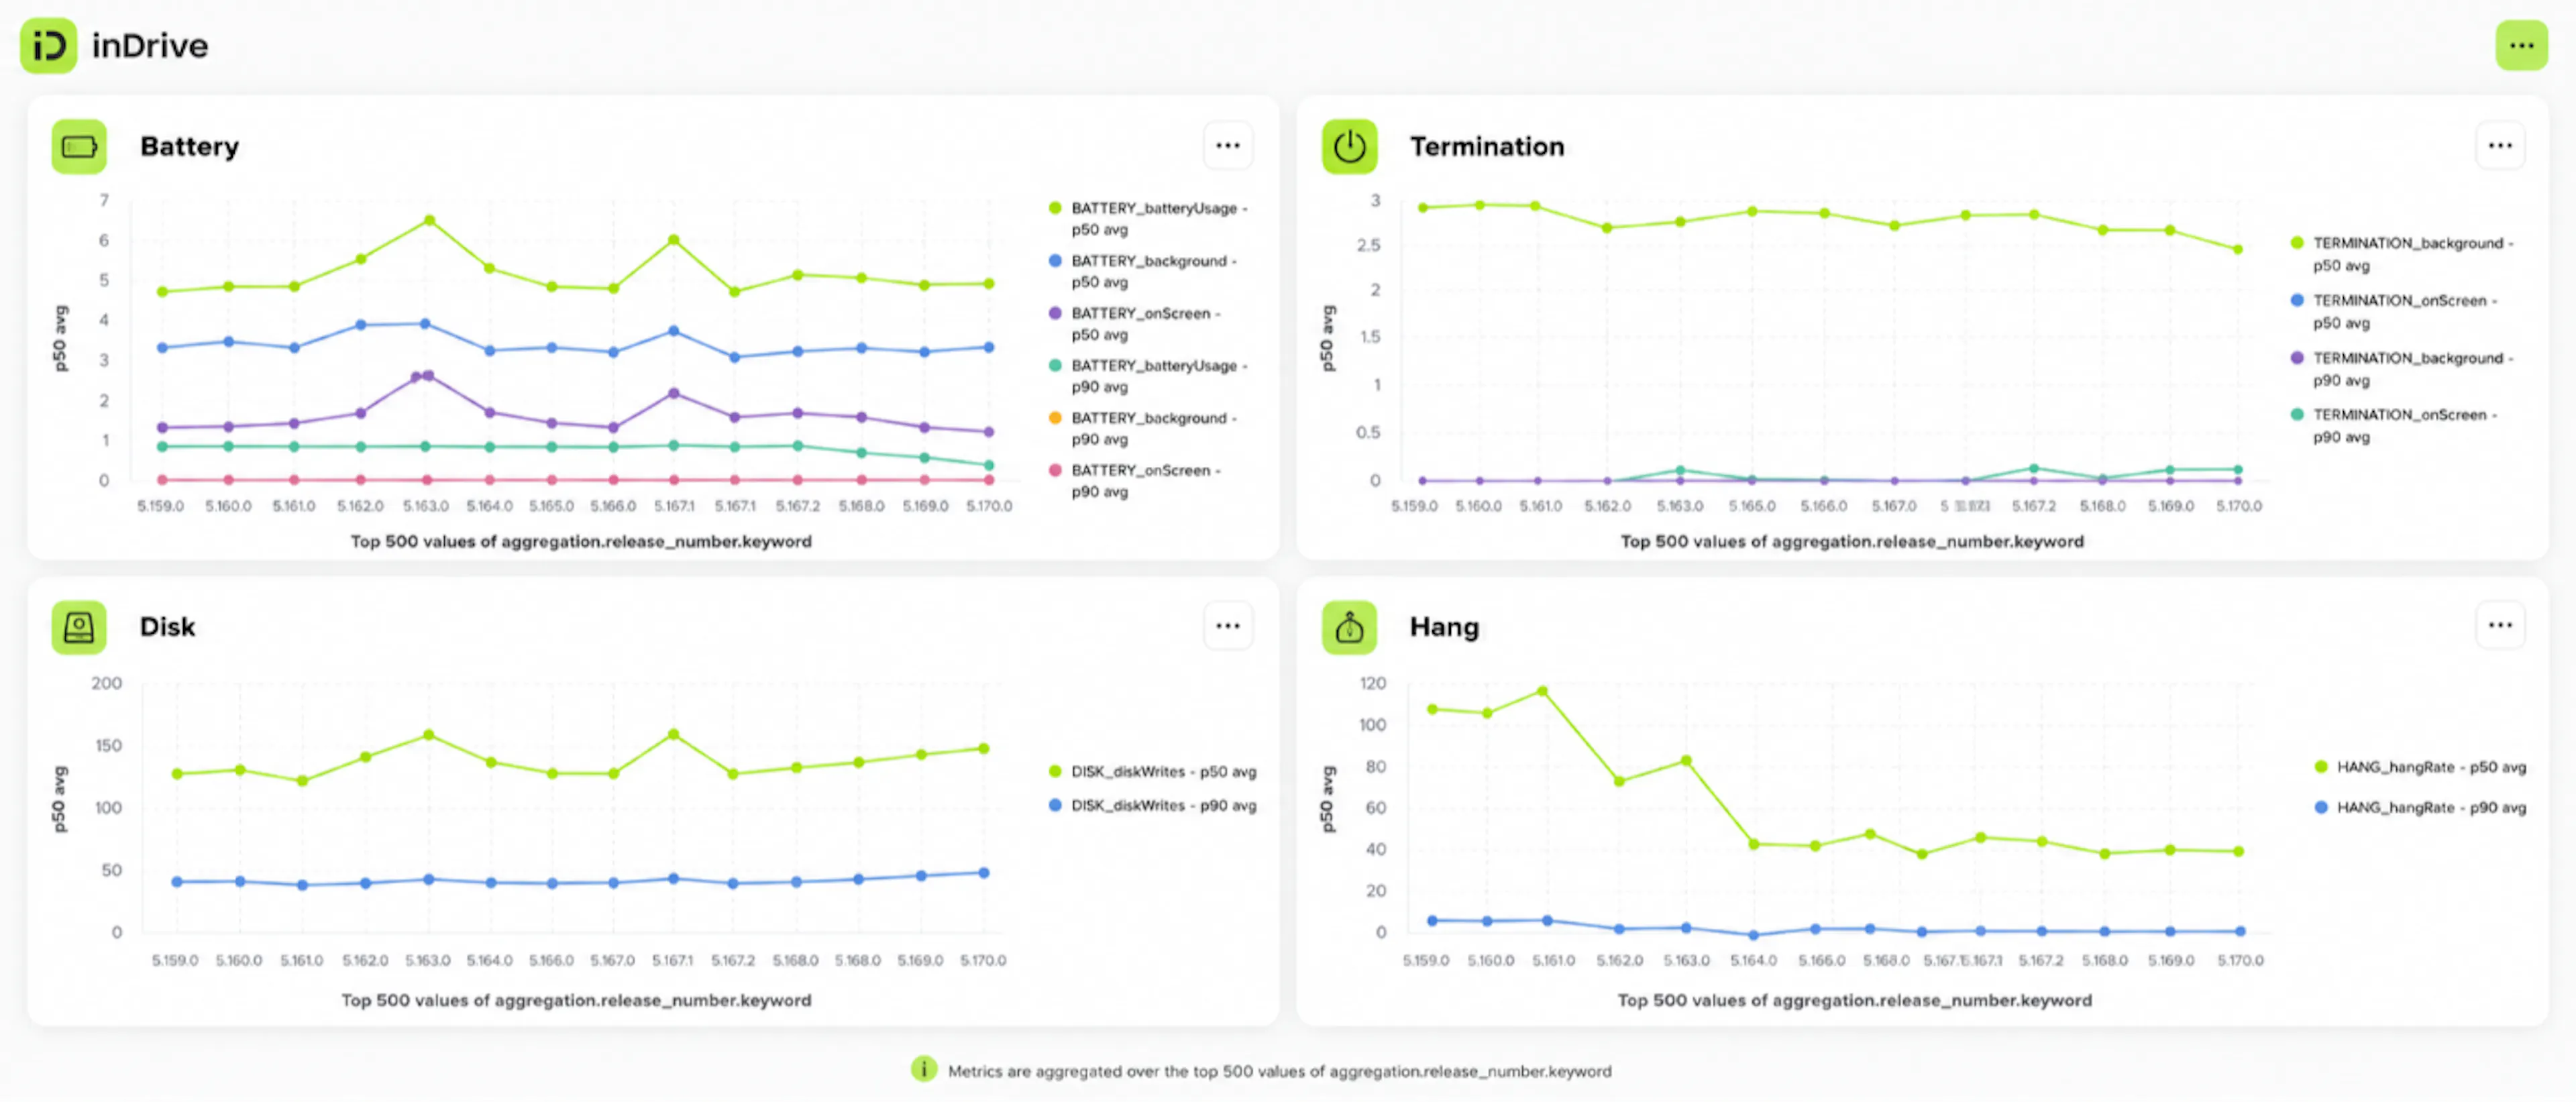
The end result of the workflow described below is a fully working pipeline plus a set of dashboards built on top of the data it produces - giving us historical trends, per-release comparisons, and a single place to monitor iOS performance across all our apps.
How It Works: Pipeline Overview
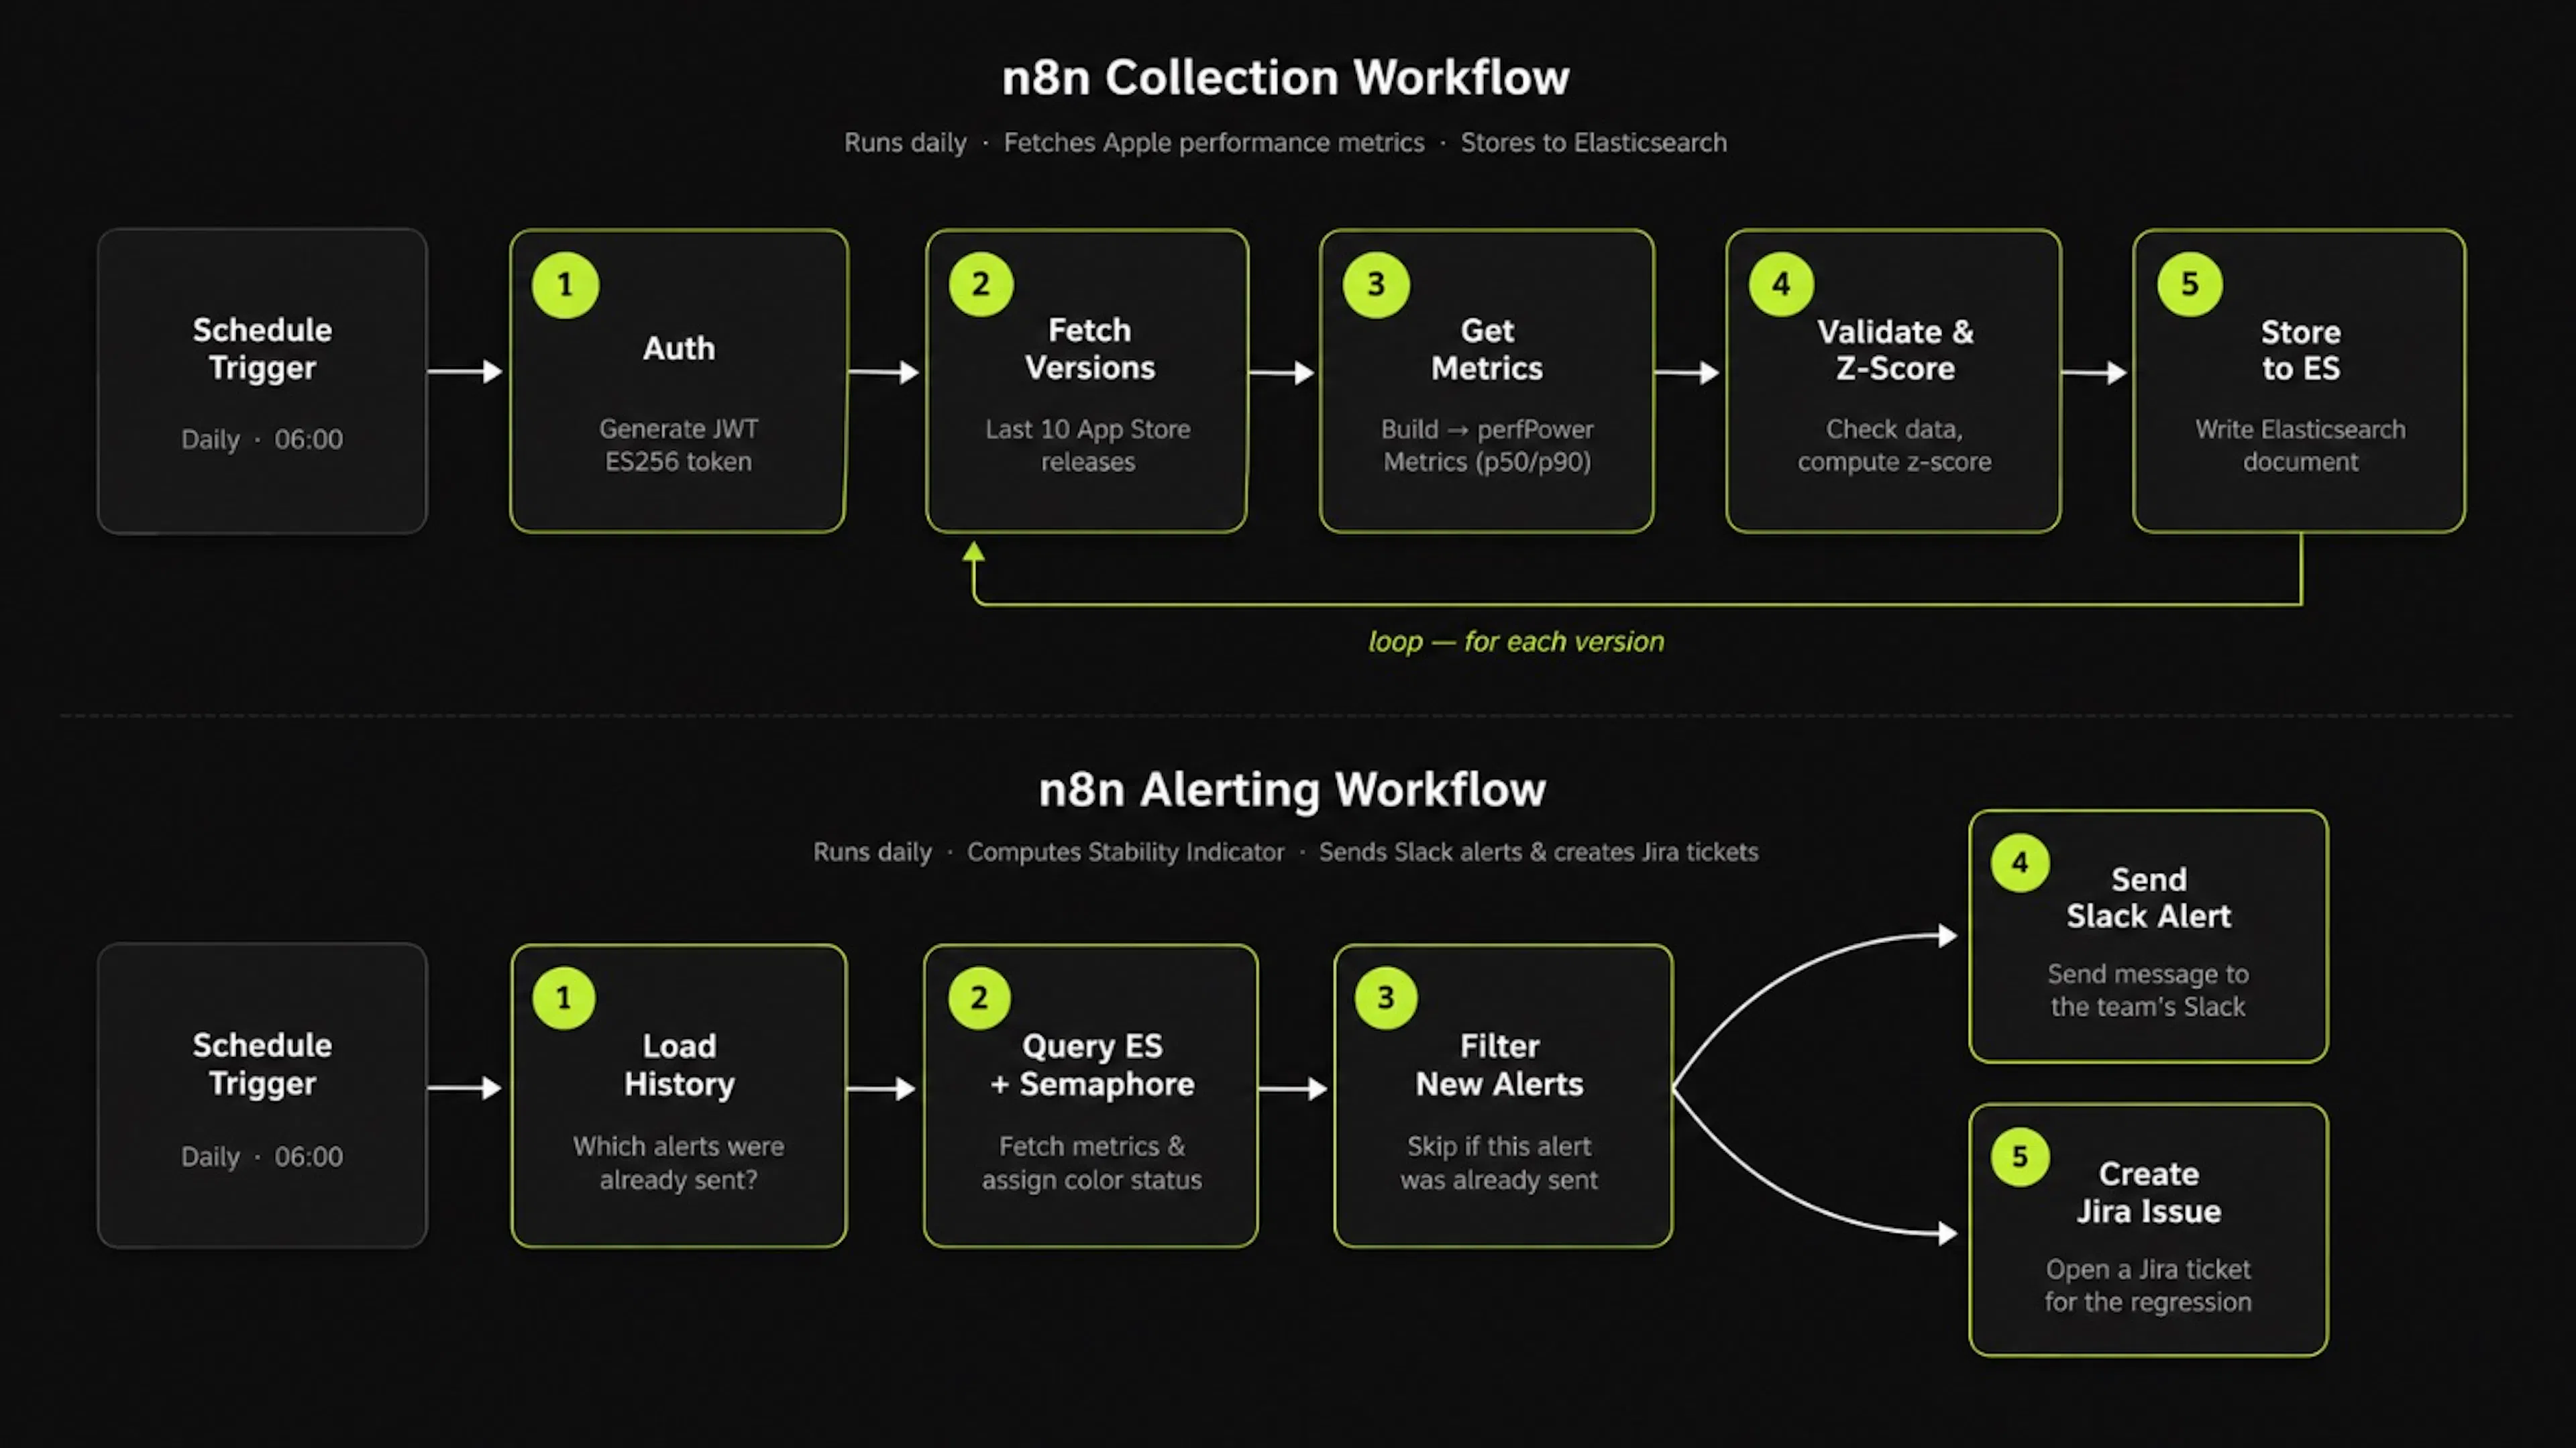
Before diving into the implementation details, here’s the big picture. The system is built around two n8n workflows that run independently every day.
The Collection Workflow talks to the Apple App Store Connect API. It authenticates, fetches the list of recent app versions, then loops over each one — pulling raw performance metrics, computing a statistical anomaly score (z-score), and writing the result to Elasticsearch (ES for short — we’ll use that abbreviation throughout the article).
The Alerting Workflow runs separately. It reads the metrics already stored in ES, computes a color-coded Stability Indicator per metric, filters out anything that was already reported, and delivers new signals to Slack and Jira.
Getting Data From App Store Connect API
Working with Apple’s App Store Connect API starts with authentication.
Access to the App Store Connect API requires a Developer role or higher in the Apple Developer Program. Only a user with the Admin role can create an API key — it’s issued in App Store Connect and works for the entire team. If you already have the necessary permissions, let’s move on to authentication.
The Apple API requires a JWT token signed with a private key using the ES256 algorithm (ECDSA + P-256). Detailed instructions for creating keys and generating tokens are in the official documentation: Creating API Keys and Generating Tokens for API Requests.
You need three things to generate the token:
- keyID — the key identifier, found in App Store Connect → Users and Access → Keys
- issuerID — your organization’s Issuer ID, a UUID string like c055ca8c-e5a8–4836-b61d-aa5794eeb3f4, on the same Keys page. This is not the Team ID — they’re often confused
- .p8 file — the private key in PEM format, downloaded once when the key is created
The JWT payload structure looks like this:
{
  "iss": "<issuerID>",
  "iat": 1716300000,
  "exp": 1716301200,
  "aud": "appstoreconnect-v1"
}
The token lives for a maximum of 20 minutes. We generate it in a separate n8n workflow and pass it as an input parameter to the main one — this isolates and reuses the authentication logic.
One non-obvious detail when implementing this in Node.js is the dsaEncoding parameter when signing:
const signatureDER = sign.sign({
  key: privateKeyPEM,
  dsaEncoding: 'ieee-p1363',
});
By default, Node.js returns the signature in DER format (ASN.1), but Apple expects IEEE P-1363. Without this parameter, the token looks valid but Apple returns 401 — and tracking down the cause without knowledge of ES256 internals is far from obvious.
Fetching Native iOS Performance Metrics
The endpoint for native metrics is perfPowerMetrics. The full API reference is available in the official Apple documentation. Getting to the endpoint requires a few steps:
1. Request the list of app versions:
GET /v1/apps/{appId}/appStoreVersions?filter[platform]=IOS&fields[appStoreVersions]=versionString,appStoreState&limit=10
The response contains a data array with versions. From each element we need versionString, appStoreState, and links.self — the last one is used to build the URL for the next request:
{
  "data": [
    {
      "id": "abc123def456",
      "attributes": {
        "versionString": "5.169.0",
        "appStoreState": "READY_FOR_SALE"
      },
      "links": {
        "self": "https://api.appstoreconnect.apple.com/v1/appStoreVersions/abc123def456"
      }
    }
  ]
}
2. For each version, fetch the associated build — the URL is constructed as links.self + /build:
GET /v1/appStoreVersions/{versionId}/build
The response contains many fields, but we only need two: data.id (the build identifier) and the perfPowerMetrics link in relationships:
{
  "data": {
    "id": "1b3aa84f-af15-4f37-a92b-dd7dbae8dacf",
    "attributes": {
      "version": "2604080504"
    },
    "relationships": {
      "perfPowerMetrics": {
        "links": {
          "related": "https://api.appstoreconnect.apple.com/v1/builds/1b3aa84f-af15-4f37-a92b-dd7dbae8dacf/perfPowerMetrics"
        }
      }
    }
  }
}
3. Extract the perfPowerMetrics link and fetch it:
GET https://api.appstoreconnect.apple.com/v1/builds/{buildId}/perfPowerMetrics
The response is a JSON with a productData → metricCategories → metrics → datasets → points hierarchy. Apple provides only two percentiles — p50 and p90. Each data point is a metric value for a specific version and device:
{
  "productData": [
    {
      "metricCategories": [
        {
          "identifier": "LAUNCH",
          "metrics": [
            {
              "identifier": "launchTime",
              "unit": {
                "displayName": "ms"
              },
              "datasets": [
                {
                  "filterCriteria": {
                    "device": "all_iphones",
                    "percentile": "percentile.ninety"
                  },
                  "points": [
                    {
                      "version": "5.167.0",
                      "value": 462.1
                    },
                    {
                      "version": "5.168.0",
                      "value": 471.8
                    },
                    {
                      "version": "5.169.0",
                      "value": 487.2
                    }
                  ]
                },
                {
                  "filterCriteria": {
                    "device": "all_iphones",
                    "percentile": "percentile.fifty"
                  },
                  "points": [
                    {
                      "version": "5.169.0",
                      "value": 312.5
                    }
                  ]
                }
              ]
            }
          ]
        }
      ]
    }
  ],
  "insights": {
    "regressions": [
      {
        "metricCategory": "LAUNCH",
        "metric": "launchTime",
        "latestVersion": "5.169.0",
        "maxLatestVersionValue": 487.2,
        "referenceVersions": ["5.167.0", "5.168.0"],
        "summaryString": "Launch time increased 8% in version 5.169.0"
      }
    ]
  }
}
After this request, n8n applies two checks. The first is for the presence of metrics: for a fresh version, productData may be empty — Apple simply hasn’t accumulated enough data yet. The second is for an HTTP error in the response: this means the version was revoked and the resource is unavailable. In both cases, the version is skipped and the workflow moves to the next one. More on this in the pitfalls section.
We filter only device = all_iphones. The last 4 versions are a sufficient horizon for trend calculation.
Tracking the Current Version Between Runs
Before diving into the workflow logic, it’s worth explaining what z-score is and why we need it.
Z-score is not the standard deviation itself — it’s a measure of how far the current value is from it. The formula: z = (x − μ) / σ, where x is the current p90 value, μ is the mean of historical data, σ is the standard deviation. Z-score shows how many “sigmas” the current result deviates from the norm: z = 0 means “exactly on the mean”, z = 2 means “two standard deviations worse than normal.” This coefficient is what we store in the ES document and use for the semaphore metric assessment. More details in the Z-score section below.
We only compute z-score for the latest current version, for two reasons. First, z-score is not a static value: it’s recalculated each time new historical data accumulates. Computing it for all versions on every run would leave ES full of documents with stale and contradictory values. Second, we only care about the current state of the product — alerting on a version that has already been superseded by two newer ones has little value.
The workflow runs daily and fetches the last 10 versions each time. The Track Latest Version node remembers the last processed version and compares it to the current one — so z-score is only computed where needed.
We do this via $getWorkflowStaticData(‘global’) — n8n’s built-in mechanism for persisting data between workflow runs:
function compareVersions(a, b) {
  const pa = a.split('.').map(Number);
  const pb = b.split('.').map(Number);

  for (let i = 0; i < Math.max(pa.length, pb.length); i++) {
    const diff = (pa[i] || 0) - (pb[i] || 0);
    if (diff !== 0) return diff;
  }

  return 0;
}

const staticData = $getWorkflowStaticData('global');
const currentVersion = $('Split Out').item.json.attributes.versionString;
const storedVersion = staticData.lastActualVersionWithMetrics ?? null;

let shouldComputeZScore = false;

if (!storedVersion) {
  // First run — save the version and compute z-score
  staticData.lastActualVersionWithMetrics = currentVersion;
  shouldComputeZScore = true;
} else {
  const cmp = compareVersions(currentVersion, storedVersion);

  if (cmp > 0) {
    // New version released — update stored version
    staticData.lastActualVersionWithMetrics = currentVersion;
    shouldComputeZScore = true;
  } else if (cmp === 0) {
    // Same current version — compute z-score again
    shouldComputeZScore = true;
  }

  // cmp < 0 — version is older than stored, z-score is not needed
}
staticData is mutated in memory and n8n persists it between runs. For older versions, _shouldComputeZScore = false — they skip the ES history query and z-score calculation and are written to the index without that field.
Handling Versions Without Metrics
Not every version in the App Store has performance data. Two scenarios are possible:
Data hasn’t accumulated yet. Apple starts aggregating metrics not immediately after a release, but as users install and run the app. For a fresh version, perfPowerMetrics will return a successful response but with an empty array: productData: [].
The version was revoked. If a release was rolled back, the resource may become unavailable — and Apple will return an HTTP error.
We handle both cases. The HTTP error is caught by the onError: continueErrorOutput parameter on the GET perfPowerMetrics node — instead of crashing, the error is routed to a separate output and control returns to the version loop. The empty array is handled by the next Has metrics? node, which checks productData.length > 0 and also skips the version. In both cases, the workflow continues processing the remaining versions normally.
Apple Insights: Built-in Regression Analysis
The perfPowerMetrics response contains not only raw metric values, but also an insights block with two arrays: regressions — metrics where Apple detected degradation — and trendingUp — metrics with a sustained upward trend. Each entry contains a human-readable summary and per-percentile breakdown:
{
  "insights": {
    "regressions": [
      {
        "metricCategory": "LAUNCH",
        "metric": "launchTime",
        "latestVersion": "5.166.0",
        "referenceVersions": [
          "5.162.0",
          "5.163.0",
          "5.164.0",
          "5.165.0"
        ],
        "summaryString": "Top (90th percentile) and typical (50th percentile) Launch Time trended up between app versions 5.162.0 to 5.166.0 on iPhone (All). The maximum value for the latest app version is at 5871.80 ms and increased by 21% compared to the average for previous 4 app versions.",
        "populations": [
          {
            "percentile": "percentile.fifty",
            "device": "all_iphones",
            "referenceAverageValue": 1477.98,
            "latestVersionValue": 1774.2,
            "deltaPercentage": 20
          },
          {
            "percentile": "percentile.ninety",
            "device": "all_iphones",
            "referenceAverageValue": 4856.65,
            "latestVersionValue": 5871.8,
            "deltaPercentage": 21
          }
        ]
      }
    ],
    "trendingUp": [
      {
        "metricCategory": "BATTERY",
        "metric": "onScreen",
        "latestVersion": "5.166.0",
        "summaryString": "Top (90th percentile) ScreenOn Location Drain trended up between app versions 5.162.0 to 5.166.0 on iPhone (All)."
      }
    ]
  }
}
insights.regressions is the easiest way to get started with performance analysis: no infrastructure needed — Apple already compared versions and wrote the summary. If you’re just starting to build a similar system, this is a good entry point.
However, there are fundamental limitations. Apple only covers its own 6 native categories — it can’t see our custom TTI metrics from Elasticsearch. The detection algorithm is a black box: Apple decides what counts as a regression and what doesn’t. We don’t know the thresholds and can’t tune the sensitivity for our product’s specifics — for some metrics a 5% increase is critical, for others even 20% is within normal range.
In essence, we’re building the same mechanism manually, but with full control: we compute the z-score ourselves, set our own thresholds, and decide what counts as critical versus normal noise. And it works not just for Apple’s metrics, but for all our telemetry in one pipeline.
System Architecture
Having understood the data sources, we move to the next step — how to assemble everything into a unified system. We don’t just need to collect metrics; we need to store them, detect anomalies, and deliver signals to the team. That’s what the architecture below describes.
The system consists of two layers:
Data collection layer — a Go service for TTI metrics from our telemetry, and an n8n workflow for metrics from the Apple API.
Alerting layer — an n8n workflow that queries Elasticsearch daily, computes metric statuses, sends notifications to Slack, and creates Jira tasks.
All data is stored in a single ES index clairvoyance-metrics-traces. This approach allows building unified dashboards in Kibana and using the same queries in both the Go service and n8n. For each metric we’ve set up dedicated dashboards — with version-over-version dynamics, p50/p90, and a goal line where Apple provides one. They’re used for in-depth trend analysis when alerting has already flagged an issue or the team wants to see the big picture.
Apple API → n8n (collection) → Elasticsearch ← Go service (TTI)
                                             ↓
                                    n8n (alerting) → Slack, Jira
Data Collection and Storage in Elasticsearch
The ES Document
Each aggregated result is stored as a separate ES document. The structure is unified for both sources — Apple API and our TTI telemetry. This is a deliberate architectural decision: one index for all metrics means unified Kibana dashboards, identical queries in the alerting workflow, and the ability to compare Apple metrics and TTI in one place.
{
  "@timestamp": "2024-05-20T12:00:00.000Z",
  "name": "AggregationAppStorePerfomanceMetrics",
  "metric": "LAUNCH_launchTime",
  "platform": "iOS",
  "aggregation": {
    "interval": 24,
    "release_number": "5.168.0",
    "timestamp": 1716163200000,
    "build_id": "abc123",
    "build_version": "5.168.0"
  },
  "payload": {
    "p50": 312.5,
    "p90": 487.2,
    "goal": "fair",
    "p90_z_score": 1.84
  }
}
The name field is the document type. It’s used to filter queries: AggregationAppStorePerfomanceMetrics — data from the Apple API, AggregatedTTI — our telemetry. The alerting workflow doesn’t know and doesn’t need to know where the data came from — it works with a unified structure.
The goal field in payload is a target value that Apple returns only for the Animation metric. Apple defines a threshold benchmark (poor/fair) for it and passes it directly in the response. We simply store this value as-is to display it as a goal line in Kibana.
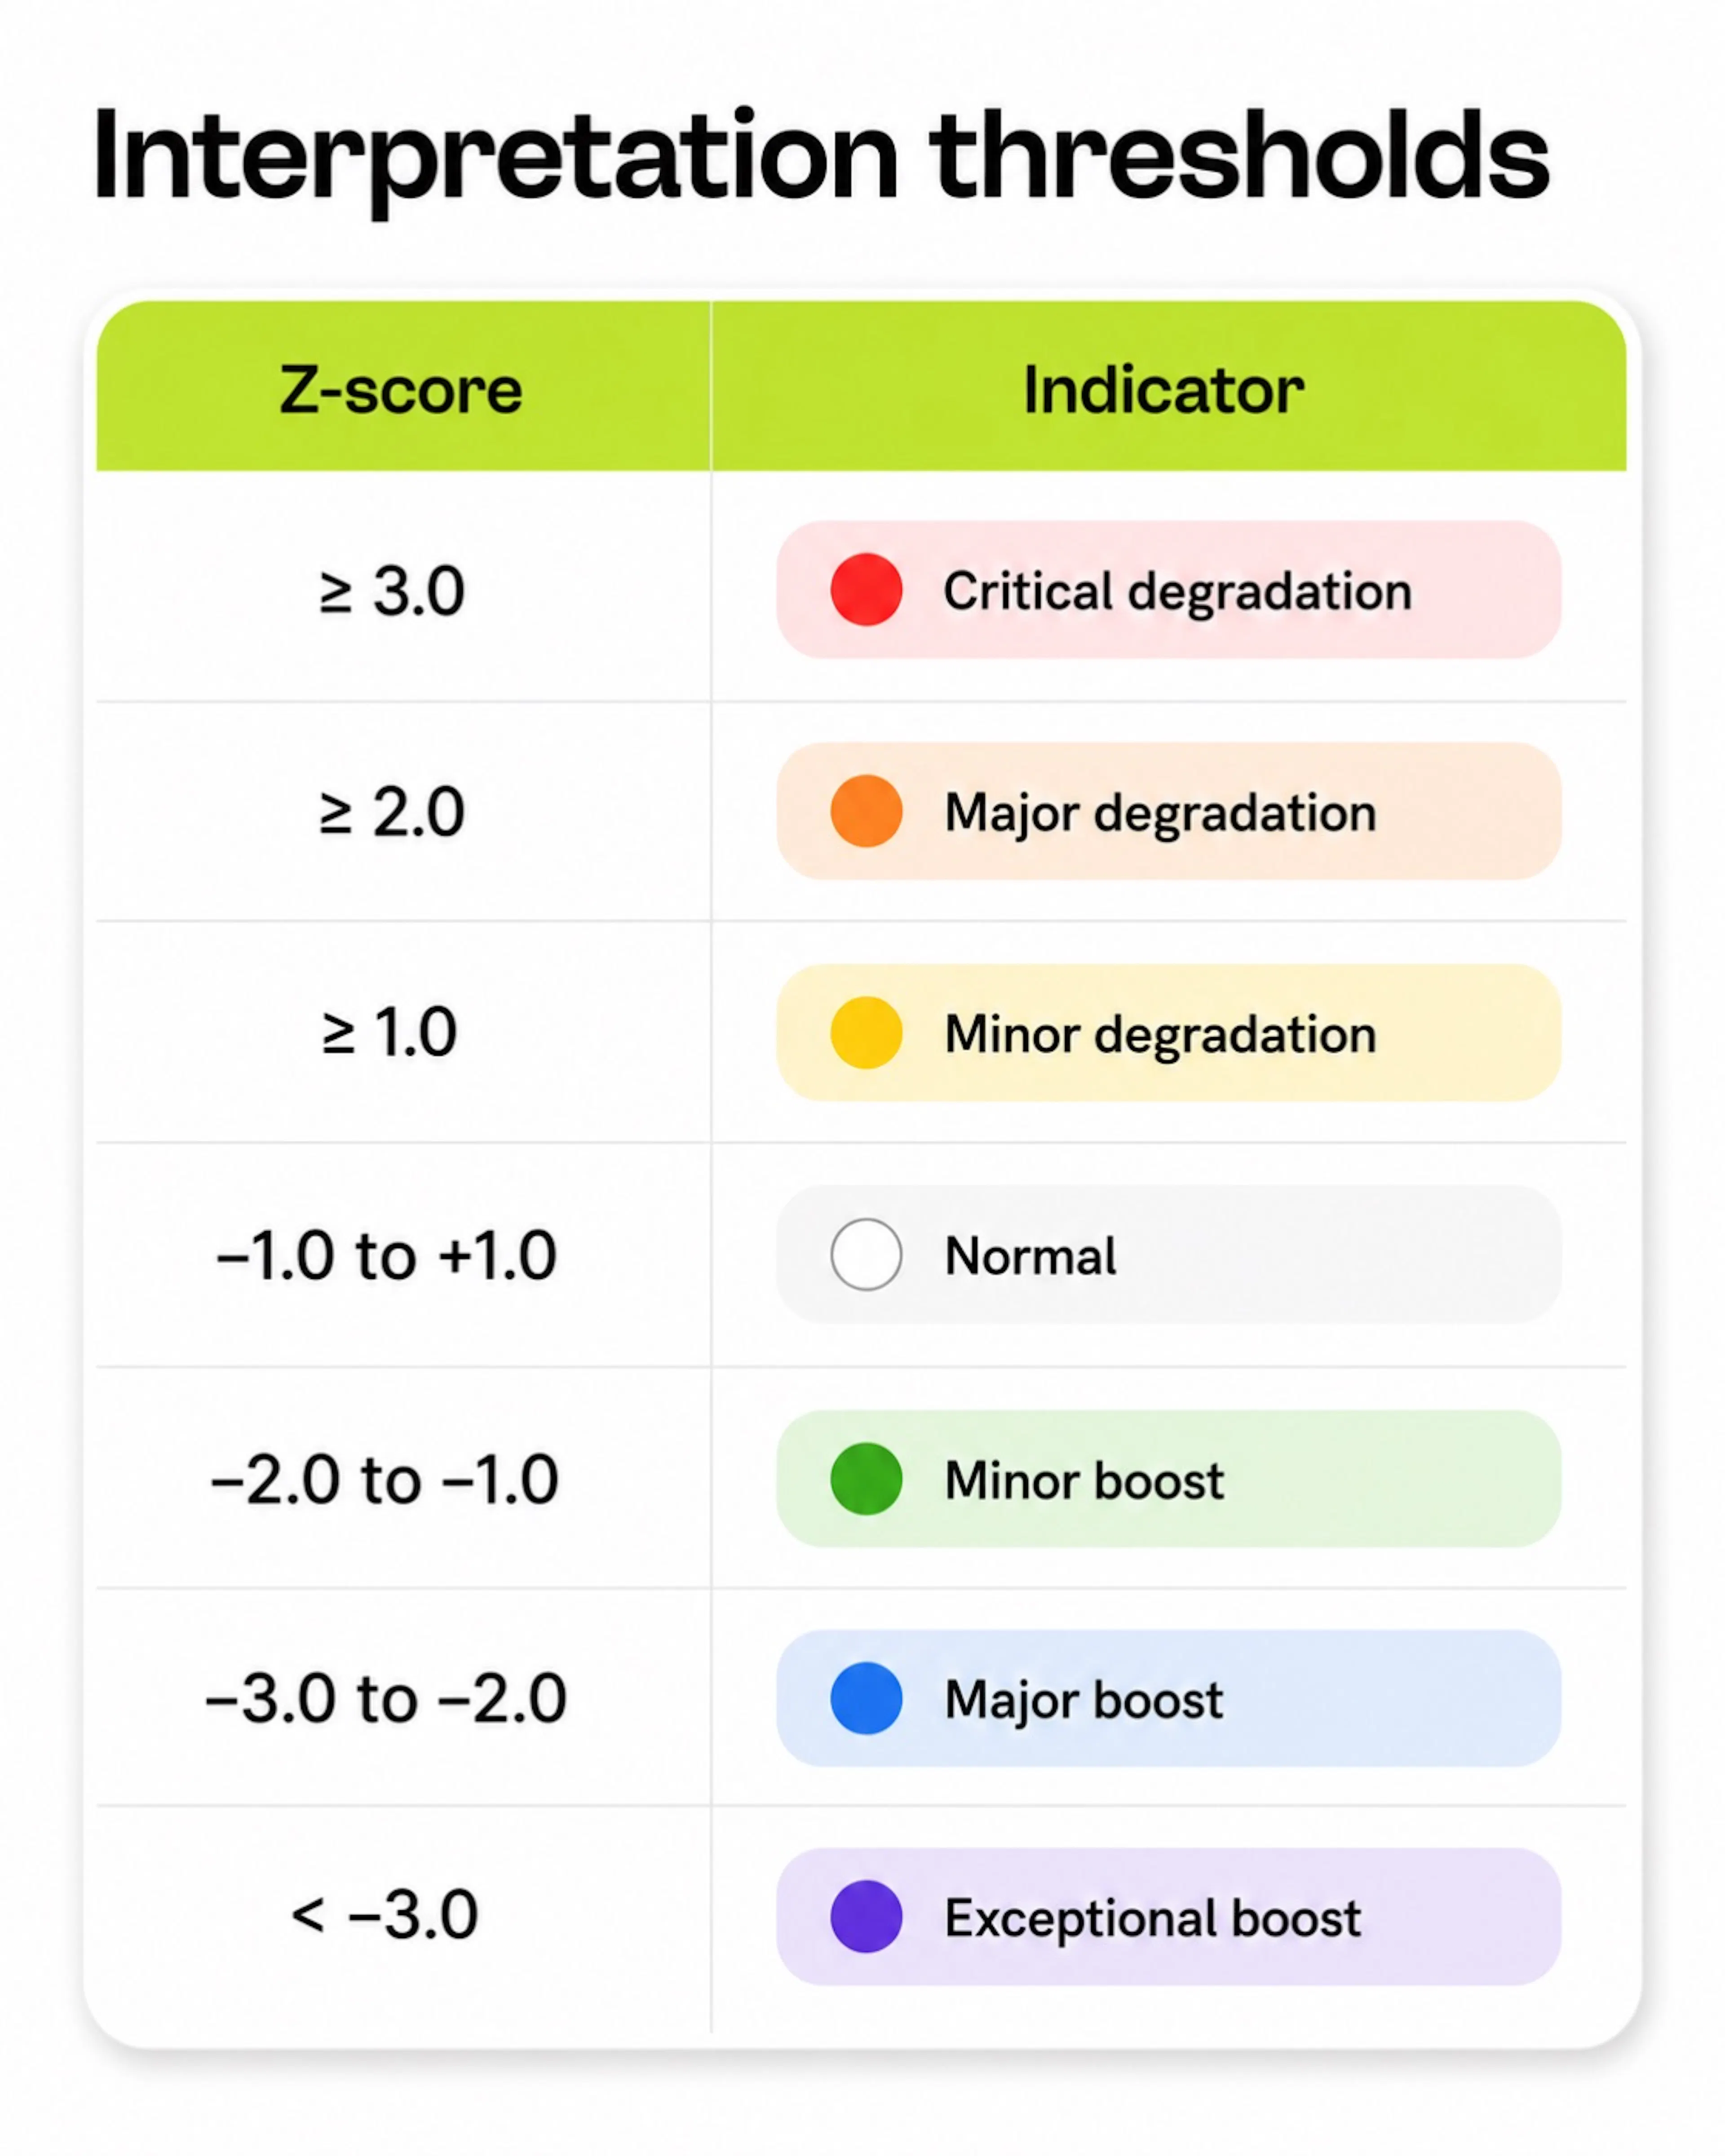
p90_z_score is stored in the document at write time — this is a deliberate choice. The value is fixed against historical data at a specific moment and never changes. Meanwhile, the semaphore indicator (🔴🟡⚪) is computed at query timevia runtime_mappings. This split means: if tomorrow we decide to change the Critical threshold from 3.0 to 2.5 — we change one line in the workflow, no need to rewrite thousands of ES documents.
Z-score as an Anomaly Measure
Z-score shows how much the current value deviates from the historical norm in units of standard deviation. Formula:
z = (x - mean) / stddev
We compute it on p90, not p50. Tail values better reflect the real experience of struggling users: if p90 increased, one in ten users feels it right now, even if the median hasn’t changed.
Before computing z-score, the Get History node fetches the last 10 documents for the same metric and platform from ES — that’s the historical baseline. Each element in hits is an ES document in the standard response format, where _sourcecontains the original document and payload.p90 is the stored percentile value.
const historicalP90 = hits
  .map(h => h._source?.payload?.p90)
  .filter(v => v != null && typeof v === 'number');

function mean(arr) {
  return arr.reduce((sum, v) => sum + v, 0) / arr.length;
}

function stddev(arr) {
  const m = mean(arr);
  const variance = arr.reduce(
    (sum, v) => sum + (v - m) ** 2,
    0
  ) / (arr.length - 1);

  return Math.sqrt(variance);
}

const meanVal = mean(historicalP90);
const stddevVal = stddev(historicalP90);

const zScore = historicalP90.length >= 2 && stddevVal > 0
  ? (latestP90 - meanVal) / stddevVal
  : 0;
To get a feel for the scale — a concrete example: historical p90 mean = 400ms, standard deviation = 50ms, current p90 = 600ms. Then z = (600 − 400) / 50 = 4.0 → 🔴 Critical degradation. If current p90 = 430ms → z = 0.6 → ⚪ Normal, everything within bounds.
If there are fewer than two historical data points, z-score is forced to 0. The reason is simple: the standard deviation of a single point is mathematically undefined, and with only one value any deviation would look like an anomaly. Better to miss an alert than to generate a false one.
Semaphore Alerting in Slack
Data in Elasticsearch exists — and the team periodically opens Kibana to check trends version over version. But relying solely on manual analysis isn’t enough: between checks, degradation can accumulate unnoticed. We need a mechanism that detects deviations on its own and delivers a signal promptly — not when someone decided to open a dashboard, but as soon as something goes wrong.
That’s what the alerting workflow does. It runs once a day, pulls fresh metrics from ES, computes a semaphore indicator per metric using z-score, and sends to Slack only what has changed since the last check. The team gets a concrete signal — which metric, which version, how bad — and can immediately start investigating rather than scanning dashboards for the problem.
Runtime Mappings in the ES Query
Instead of storing the text indicator in ES (and recalculating it when thresholds change), we compute it at runtime directly inside the search query. ES supports runtime_mappings — Painless scripts that add virtual fields to each document:
{
  "runtime_mappings": {
    "Stability Indicator": {
      "type": "keyword",
      "script": {
        "source": "def z = null; if (doc.containsKey('payload.p90_z_score') && doc['payload.p90_z_score'].size() > 0) { z = doc['payload.p90_z_score'].value; } if (z != null) { if (z >= 3.0) { emit('🔴 Critical degradation'); } else if (z >= 2.0) { emit('🟠 Major degradation'); } else if (z >= 1.0) { emit('🟡 Minor degradation'); } else if (z > -1.0) { emit('⚪️ Normal'); } else if (z > -2.0) { emit('🟢 Minor boost'); } else if (z > -3.0) { emit('🔵 Major boost'); } else { emit('🟣 Exceptional boost'); } }"
      }
    }
  }
}
The second mapping — Stability indicator metric — translates technical metric identifiers into readable names: LAUNCH_launchTime → Launch Time, MEMORY_peakMemory → Peak Memory, BATTERY_batteryUsage → Battery Usage, and so on for all supported metrics.
Both fields are used together when composing the Slack message: the team sees iOS · Launch Time · 5.168.0 · 🟡 Minor degradation instead of the technical identifier LAUNCH_launchTime.
The advantage of this approach: thresholds are stored in one place — in the workflow code. If we decide to change the Critical threshold from 3.0 to 2.5, we change one line rather than rewriting thousands of ES documents.
Alert Deduplication
The most insidious problem in any monitoring system is repeated alerts. If Launch Time for version 5.168 degraded yesterday and we sent a Slack message, nothing has changed today — there’s no point sending it again.
We solve this using DataTable in n8n — a built-in key-value database that survives workflow restarts and persists state between runs. At the start of each workflow run, we load all previously sent alerts:
const existingAlerts = new Set();
const dataTableNode = $('Get Used iOS Alerts');

if (dataTableNode && dataTableNode.all()) {
  dataTableNode.all().forEach(item => {
    const row = item.json;

    if (row && row.alert_key) {
      existingAlerts.add(row.alert_key);
    }
  });
}
The alert key includes platform, metric, indicator, and release:
function createAlertKey(platform, metric, indicator, release) {
  const p = (platform || '').trim().toLowerCase();
  const m = (metric || '').trim().toLowerCase();
  const i = (indicator || '').trim().toLowerCase();
  const r = (release || '').trim().toLowerCase();

  return `${p}-${m}-${i}-${r}`;
}
Including the indicator in the key is intentional. If Launch Time in version 5.168 was 🟡 yesterday but became 🔴 today — that’s a different key, meaning a new event, meaning a new alert. The team needs to know the situation has worsened. Without the indicator in the key, a re-alert on escalating degradation would simply be silenced.
Jira Integration with Smart Deduplication
Why Not Just Slack
Slack is great for real-time notifications, but poor as a tracker. Messages get lost, tasks don’t get assigned. For degradations that require real investigation, we automatically create Jira tickets.
Deduplication Key: One Ticket per Metric per Release
Jira deduplication works differently from Slack. We don’t need to create a new ticket every time the indicator changes — one ticket per metric per release. If a ticket for Launch Time in version 5.168.0 already exists, we don’t touch it again, even if the degradation escalated from 🟡 to 🔴.
The key is built from the release and normalized metric name:
function createJiraKey(release, metric) {
  const r = (release || '').trim().toLowerCase();
  const m = (metric || '').trim().toLowerCase().replace(/\s+/g, '_');

  return `jira-ios-${r}-${m}`;
}

// Example:
// jira-ios-5.168.0-launch_time
Before creating a ticket, we check two sets:
- existingAlerts — keys from DataTable (what was created in previous runs)
- seen — keys we’ve already processed in this run (to handle ES duplicates)
if (existingAlerts.has(jiraKey)) continue; // Already created before
if (seen.has(jiraKey)) continue;           // Already processed this run

seen.add(jiraKey);
If both checks pass — we create the task with a description and a link to the Kibana dashboard.
Jira Ticket Creation Flow
ES data → degradation filter → check existingAlerts and seen
    ↓
Create Jira Issue (one task per metric/release)
    ↓
Save jira_key to DataTable
System Architecture
The final architecture has two main layers.
The first layer collects data:
Apple App Store Connect API → n8n workflow → Elasticsearch
Internal TTI telemetry → Go service → Elasticsearch
The second layer handles alerting:
Elasticsearch → n8n alerting workflow → Slack + Jira
All metrics are stored in a shared Elasticsearch index. This allows us to build unified Kibana dashboards and reuse the same alerting model for different metric sources.
The architecture is intentionally simple.
n8n handles orchestration well. Elasticsearch is already part of the observability stack. Jira and Slack are where engineering teams already work.
The value of the system is not in adding another dashboard. The value is in connecting performance signals to the team’s daily workflow.
Lessons Learned
Missing data is not zero
When Apple does not have enough data for a release, the value may be missing. Treating that as zero would produce meaningless Z-scores and false alerts.
Absence of data must be handled as a separate state.
Fresh releases need patience
Performance metrics are not always available immediately after release. Apple needs time to aggregate real-world usage. The workflow should expect this and continue gracefully.
Deduplication rules should match the channel
Slack and Jira have different purposes.
Slack is for events. Jira is for work.
That is why Slack deduplication includes the status, while Jira deduplication does not. A status change deserves a Slack update, but not necessarily a new Jira ticket.
Statistical alerts need enough history
Z-score only works when there is enough historical data. With too few points, the system should avoid pretending to be confident.
Internal storage has limits
n8n DataTable is simple and convenient, but it is not an infinite event store. If alert history grows too much, old entries need to be cleaned up or moved to external storage.
Simple tools are often enough for a first production version, but their limits should be explicit.
What Changed for the Team
Before this system, checking performance after release required manual attention.
Someone had to open dashboards, compare versions, notice unusual values, and decide whether the change mattered. This process worked only when people remembered to do it.
Now the workflow runs automatically every day.
It fetches fresh performance data, calculates statistical deviation, determines the severity, checks whether the alert is new, sends Slack notifications, and creates Jira tickets for regressions.
For engineers, this means less dashboard babysitting.
For the product, it means performance regressions are less likely to silently become part of the user experience.
For the organization, it means mobile performance becomes a process, not a personal habit.
Conclusion
Performance monitoring is not just about collecting metrics.
It is about building a system that helps teams notice meaningful changes, reduce noise, and act before users are affected at scale.
By combining Apple’s native iOS performance data, internal telemetry, Elasticsearch, Z-score anomaly detection, Slack alerts, and Jira automation, we built a practical monitoring pipeline that fits into the way our engineering teams already work.
The core idea is simple:
Do not wait until users tell you the app became slower. Build a system that tells the team first.
如有侵权请联系:admin#unsafe.sh